World Smartest Countries

The World’s Smartest Countries
Which are the best-educated nations in the world?
The human brain is capable of some pretty incredible stuff and is the epicentre of our bodies. This is why it’s important to look after your brain and keep track of your brain health. Because a healthy brain is a healthy human.
With our smarts in mind, we wanted to discover where in the world can claim to be the smartest. We’ve analysed factors such as educational attainment, test scores and how many innovative and ground-breaking individuals each country has produced, to find out.
The top three smartest countries in the world
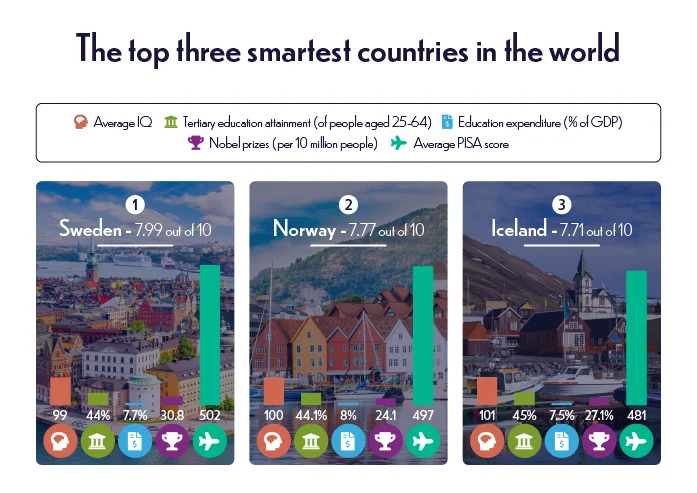
1. Sweden – 7.99 out of 10
Average IQ – 99
Tertiary education attainment – 44% of people aged 25-64
Education expenditure – 7.7% of GDP
Nobel Prizes – 30.8 per 10 million people
Average PISA score – 502
Taking the top spot overall was Sweden, with an average score of 7.99 across all five factors. Sweden had the second-highest expenditure on education and also the third-highest number of Nobel Prize winners per capita, with the prize’s founder, Alfred Nobel, also hailing from the country.
2. Norway – 7.77 out of 10
Average IQ – 100
Tertiary education attainment – 44.1% of people aged 25-64
Education expenditure – 8% of GDP
Nobel Prizes – 24.1 per 10 million people
Average PISA score – 497
Just behind Sweden, in second, was neighbouring Norway. Norway had the highest level of spending when it comes to education, which is equivalent to 8% of the nation’s GDP and also scored highly across the board. Norwegian Nobel Prize winners include writer Knut Hamsun and explorer Fridtjof Nansen.
3. Iceland – 7.71 out of 10
Average IQ – 101
Tertiary education attainment – 45% of people aged 25-64
Education expenditure – 7.5% of GDP
Nobel Prizes – 27.1 per 10 million people
Average PISA score – 481
Rounding out the top three was another Nordic country, Iceland, with an average score of 7.71 out of 10. Like their neighbours in Sweden and Norway, Iceland scored highly across the board, but particularly for both their spending on education services and their number of Nobel Prize winners per capita.
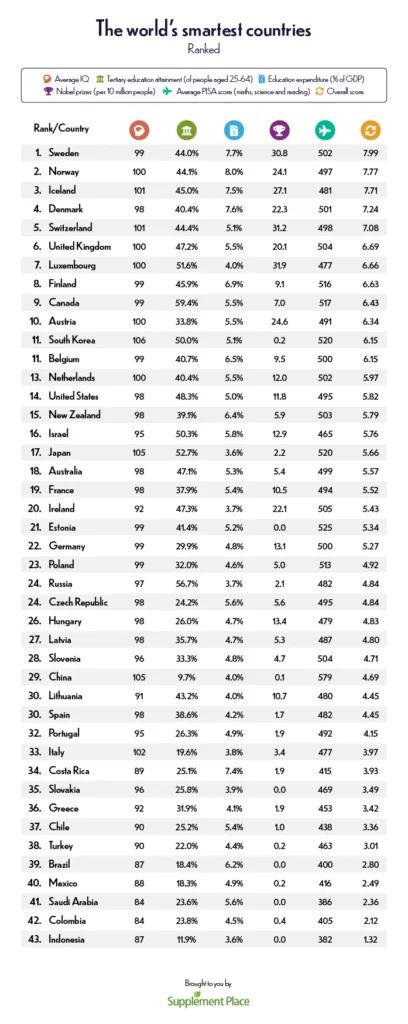
The world’s smartest countries
The top-ranking countries for…
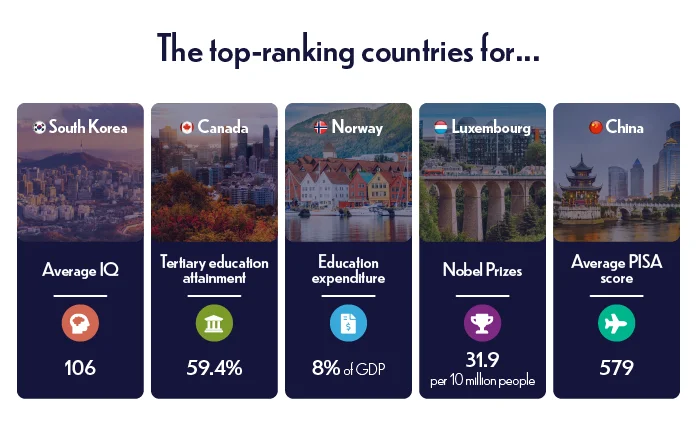
Average IQ – South Korea (106)
IQ can be a controversial tool for determining intelligence, as it can suggest that one country is inherently ‘smarter’ than another, when in fact, it is largely determined by the wealth of a country, and therefore the access to education that is available. Regardless, it was South Korea that produced the highest IQ score of the countries that we looked at, and it’s also the birthplace of former child prodigy Kim Ung-yong, who claims to have held the Guinness World Record for the highest IQ in the world, at 210. Notably, each of the top three countries were all located in Asia.
Tertiary education attainment – Canada (59.4%)
Tertiary education refers to any education for those above school age, such as college or university, so is a good way to show how many people are pursuing further education. Canada topped the list for this metric, with just under 60% of people aged 25 to 64 having completed some kind of education after their school days.
Education expenditure – Norway (8% of GDP)
The country which came second in our overall ranking also topped the list when it came to their government spending on education, at 8% of the country’s GDP (gross domestic product). As one of the wealthier and more successful countries in the world, it’s perhaps no surprise to see that Norway invests so much into educating the next generation.
Nobel Prizes – Luxembourg (31.9 per 10 million people)
Nobel Prize winners are amongst the smartest people in history and have made significant contributions to our advancement as a race. While larger countries such as the USA and the UK have produced the most Nobel Prize winners, when we normalise this per population, it’s the tiny nation of Luxembourg that comes out on top. Of course, this is largely helped by the fact that the nation has such a small population, but to have even produced one Nobel Prize winner is impressive for a country of just 626,000 people.
Average PISA score – China (579)
PISA is the Programme for International Student Assessment and is perhaps the best worldwide comparison available when it comes to the performance of school students. The assessment gives each nation three scores, one for mathematics, one for science and one for reading, and we’ve taken an average of all three, with China coming out on top with an average score of 579.
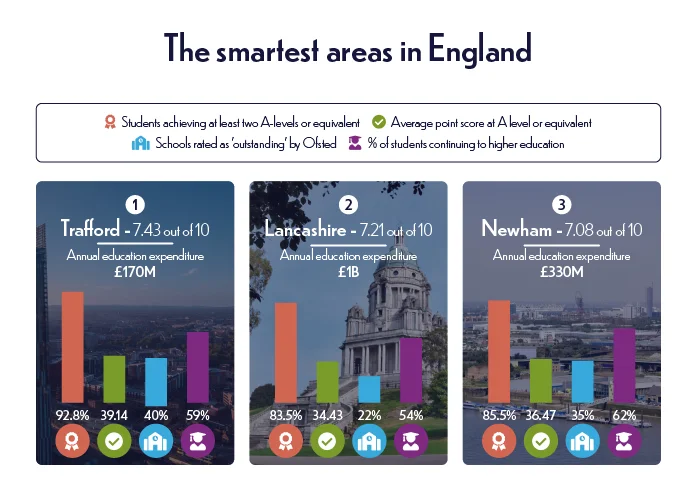
The smartest areas in England
With the UK sitting fairly high in our global ranking, in sixth place, we also wanted to take a deeper look into the part of the country with the highest educational attainment.
Unfortunately, with educational systems varying between the four nations of the UK, comparable data was not available, so we’ve analysed some of the smartest local authorities in England.
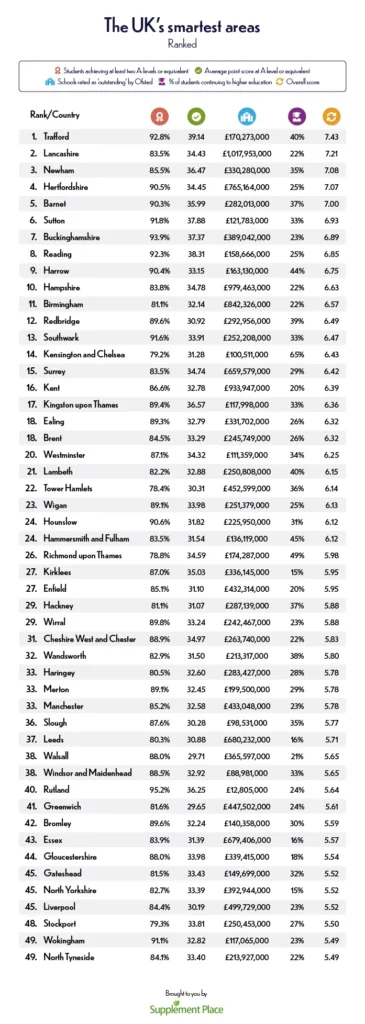
1. Trafford – 7.43 out of 10
Students achieving at least two A-levels or equivalent – 92.8%
Average Point Score at A level or equivalent – 39.14
Annual education expenditure – £170,273,000
Schools rated as ‘outstanding’ by Ofsted – 40%
% of students continuing to higher education – 59%
Taking the top spot for England was Trafford with an overall score of 7.43 out of ten. This borough of Greater Manchester scored impressively on a number of factors, with a higher rate of 16-18-year-olds going on to higher education than anywhere else in the country (59%), as well as the third-highest rate of students achieving at least two A-levels (92.8%). In fact, the only metric on which Trafford scored poorly, was that of education expenditure.
2. Lancashire – 7.21 out of 10
Students achieving at least two A-levels or equivalent – 83.5%
Average Point Score at A level or equivalent – 34.43
Annual education expenditure – £1,017,953,000
Schools rated as ‘outstanding’ by Ofsted – 22%
% of students continuing to higher education – 54%
In second place was another local authority in the North West, Lancashire, largely due to the fact that the county council had the highest spending on education, and was the only area with an expenditure of over £1 billion. Lancashire also had a high number of students achieving at least two A-levels (83.5%).
3. Newham – 7.08 out of 10
Students achieving at least two A-levels or equivalent – 85.5%
Average Point Score at A level or equivalent – 36.47
Annual education expenditure – £330,280,000
Schools rated as ‘outstanding’ by Ofsted – 35%
% of students continuing to higher education – 62%
The highest-ranking authority from outside the north was Newham, in London, with a score of 7.08 out of 10. Newham had the fourth-highest number of sixth-form level students continuing on to higher education (62%), with high levels of those students also achieving at least two A-levels or equivalent (85.5%).
The UK’s smartest areas
Methodology
Global ranking
We analysed each country on the following five factors, giving each country a normalised score out of ten on each of the factors, before taking an overall average across all five. Countries for which comparable data wasn’t available across all five factors were omitted.
Average IQ
Average IQ score according to World Population Review. Aggregated results from the international IQ test.
Tertiary education attainment
The percentage of people aged 25 to 64 who have completed tertiary education, according to OECD’s education at a glance statistics.
Education expenditure
The amount of government spending on education as a percentage of each nation’s GDP, according to Wikipedia, which draws information from a number of sources, but predominantly the World Bank.
Nobel Prizes
The number of Nobel Prizes awarded to people from each country, according to Wikipedia’s list of Nobel laureates by country. Certain prize winners may be counted for more than one country (for example if they were born in one country but are a resident of another) and multiple prize winners were counted more than once too. This was then calculated per 10 million people using Wikipedia’s list of countries and dependencies by population, which uses various official local statistics and those from the UN.
Average PISA results
The average score for mathematics, science and reading from the 2018 results of the Programme for International Student Assessment. Not that data was not available for ‘reading’ results for Spain, so here we just took an average of the mathematics and science scores.
England ranking
We analysed each local authority in England on the following five factors, giving each country a normalised score out of ten on each of the factors, before taking an overall average across all five. Unfortunately, with educational systems varying between the four nations of the UK, comparable data was not available, which is why authorities in Scotland, Wales and Northern Ireland have been omitted.
Students achieving at least two A-levels or equivalent
The percentage of state-funded students achieving at least two substantial level 3 qualifications, according to the Department for Education’s A level and other 16 to 18 results statistics (2018 to 2019). Level 3 qualifications include A-levels, as well as other qualifications such as access to higher education diplomas, advanced apprenticeships and international Baccalaureate diplomas.
Average Point Score at A level or equivalent
The average point score per state-funded student at level 3, according to the Department for Education’s A level and other 16 to 18 results statistics (2018 to 2019). The average point score is a comparable metric used to compare student achievement across different qualifications.
Annual education expenditure
The annual total expenditure on education according to the Ministry of Housing, Communities & Local Government’s, local authority revenue expenditure and financing England statistics (2019 to 2020 final outturn).
Schools rated as ‘outstanding’ by Ofsted
The percentage of schools rated as outstanding by Ofsted, as of August 30 2020, according to Ofsted’s Data View.
% of students continuing to higher education
The percentage of students in a UK higher education institution after completing key stage 5, according to the Department for Education’s education statistics by LA district and pupil disadvantage.